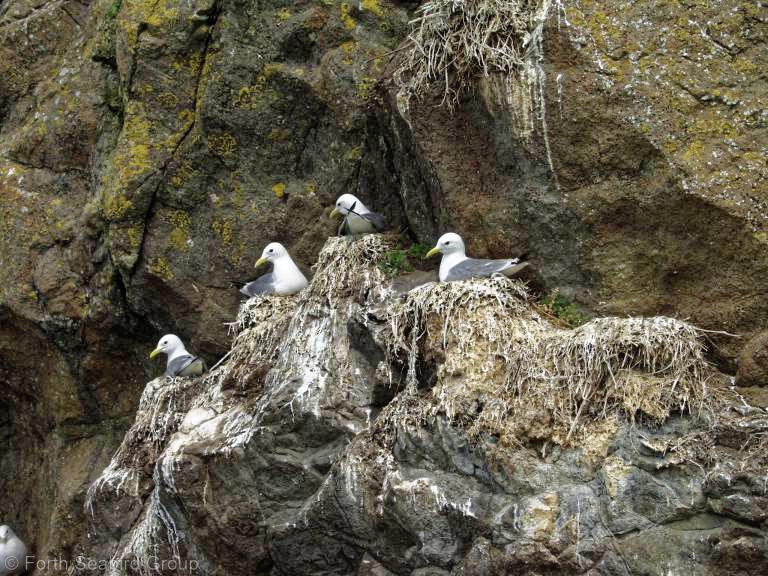
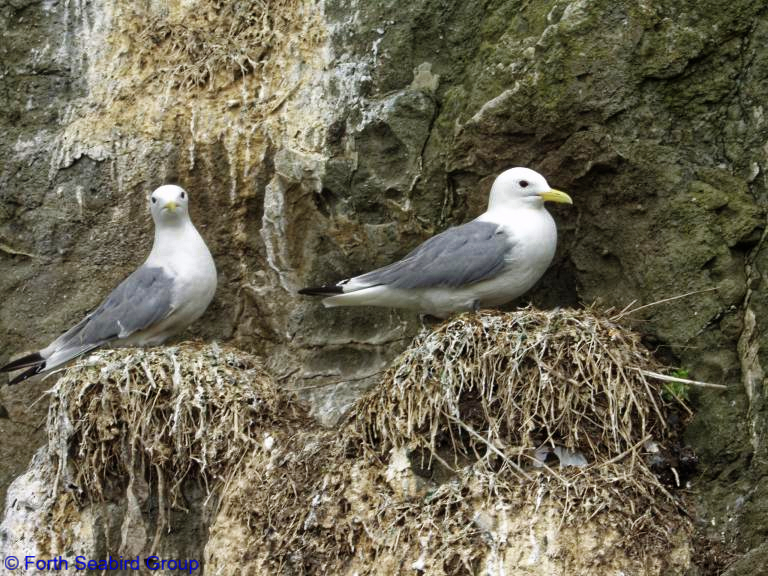
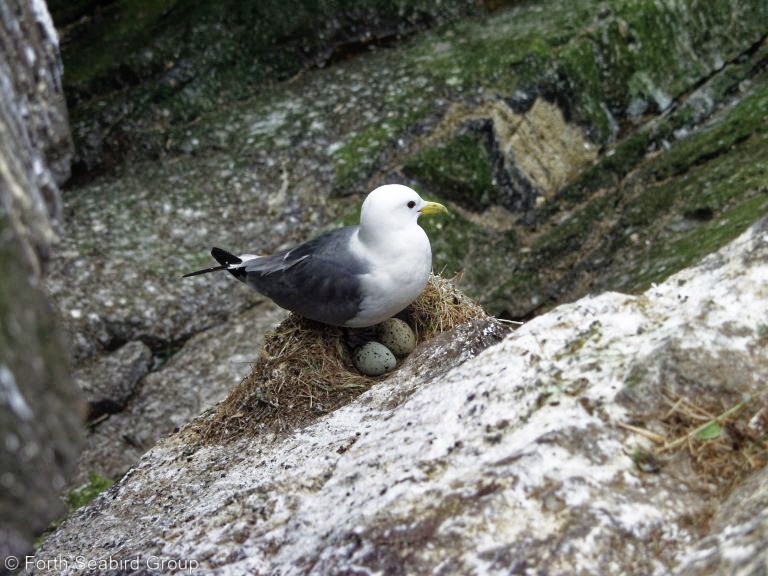
When counting Kittiwake, we count the number of apparently occupied nests. This can be nests where the birds are apparently incubating or brooding; or other well-built nests including empty ones capable of holding eggs.
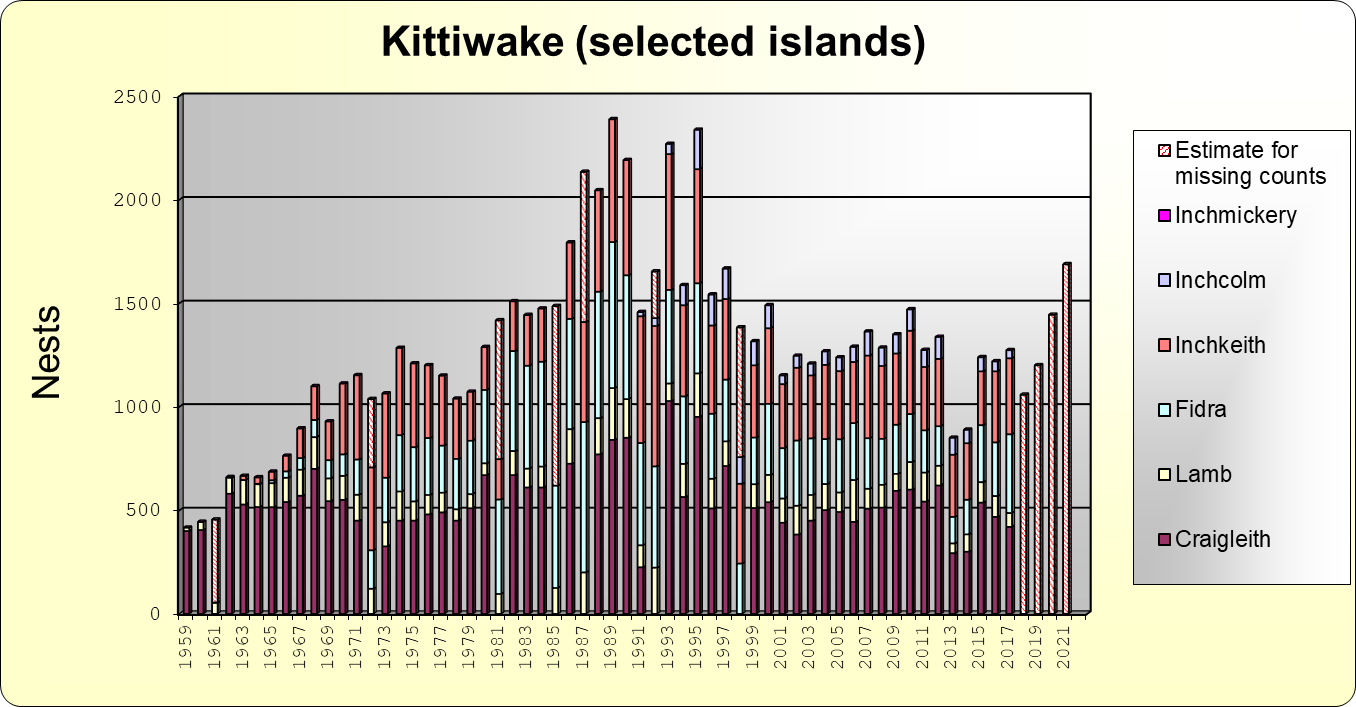
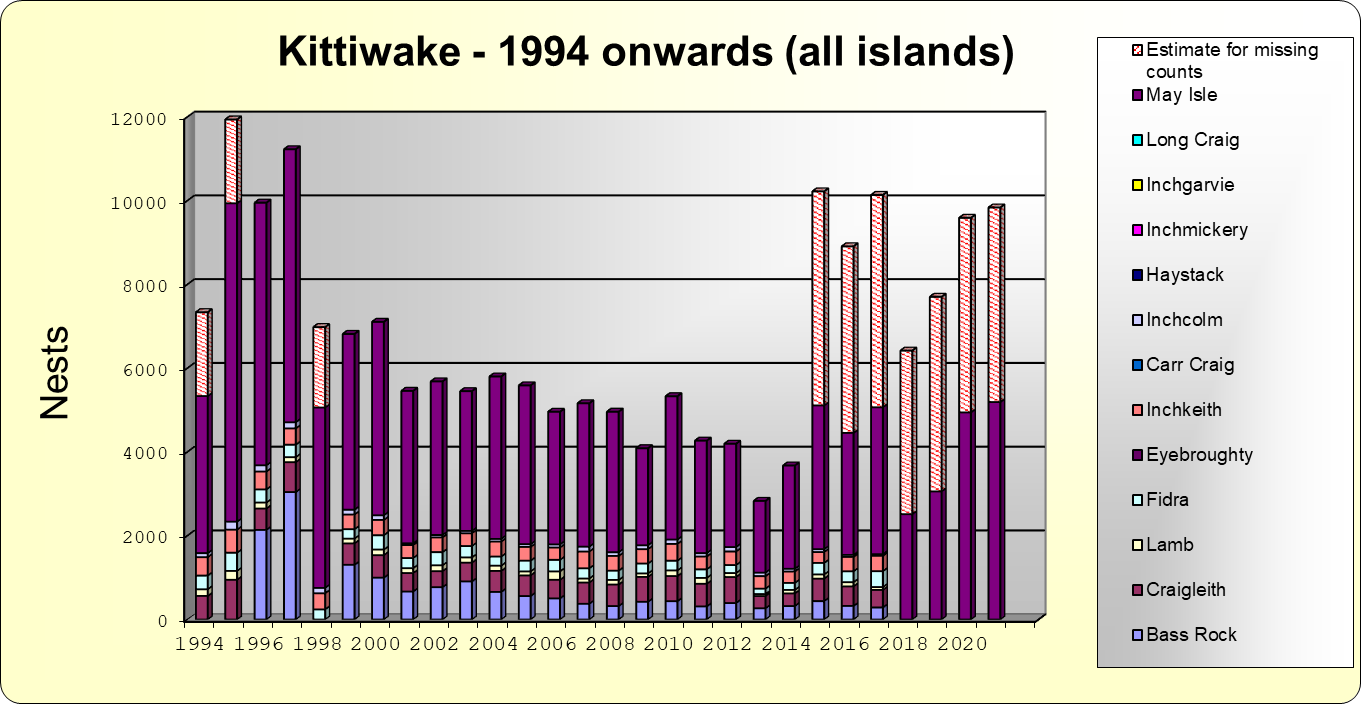
Note: To try and make the charts more meaningful, where the counts are incomplete an estimate has been made for the missing figures. The counts for the years on either side of the missing count are compared, and the lower value is taken as the estimate.
1: Click here for table of kittiwake counts
Here you will find the figures for all the counts since they started in 1959.
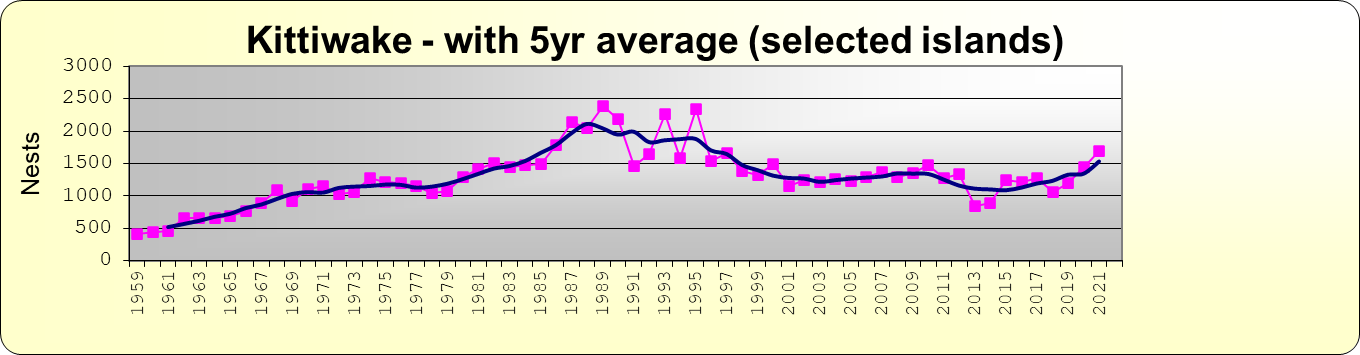
2: Charts for number of nests, selected islands
These charts show the number of nests counted each year since 1959. As figures are not available for
all islands, these charts only show the counts for Craigleith, Fidra, Lamb, Inchcolm, Inchmickery and Inchkeith.
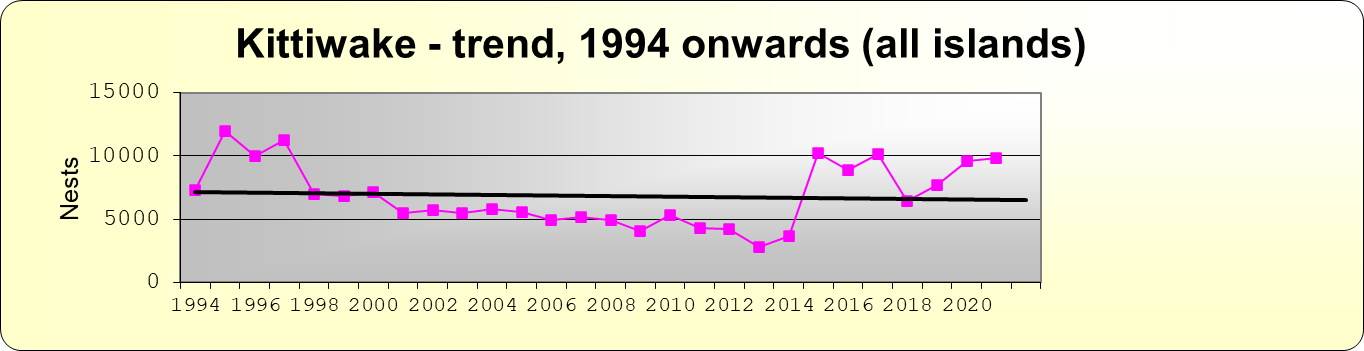
3: Charts for number of nests counted on ALL islands, 1994 onwards
These charts show the number of nests counted each year since 1994. These are the years where
figures are available for all islands.
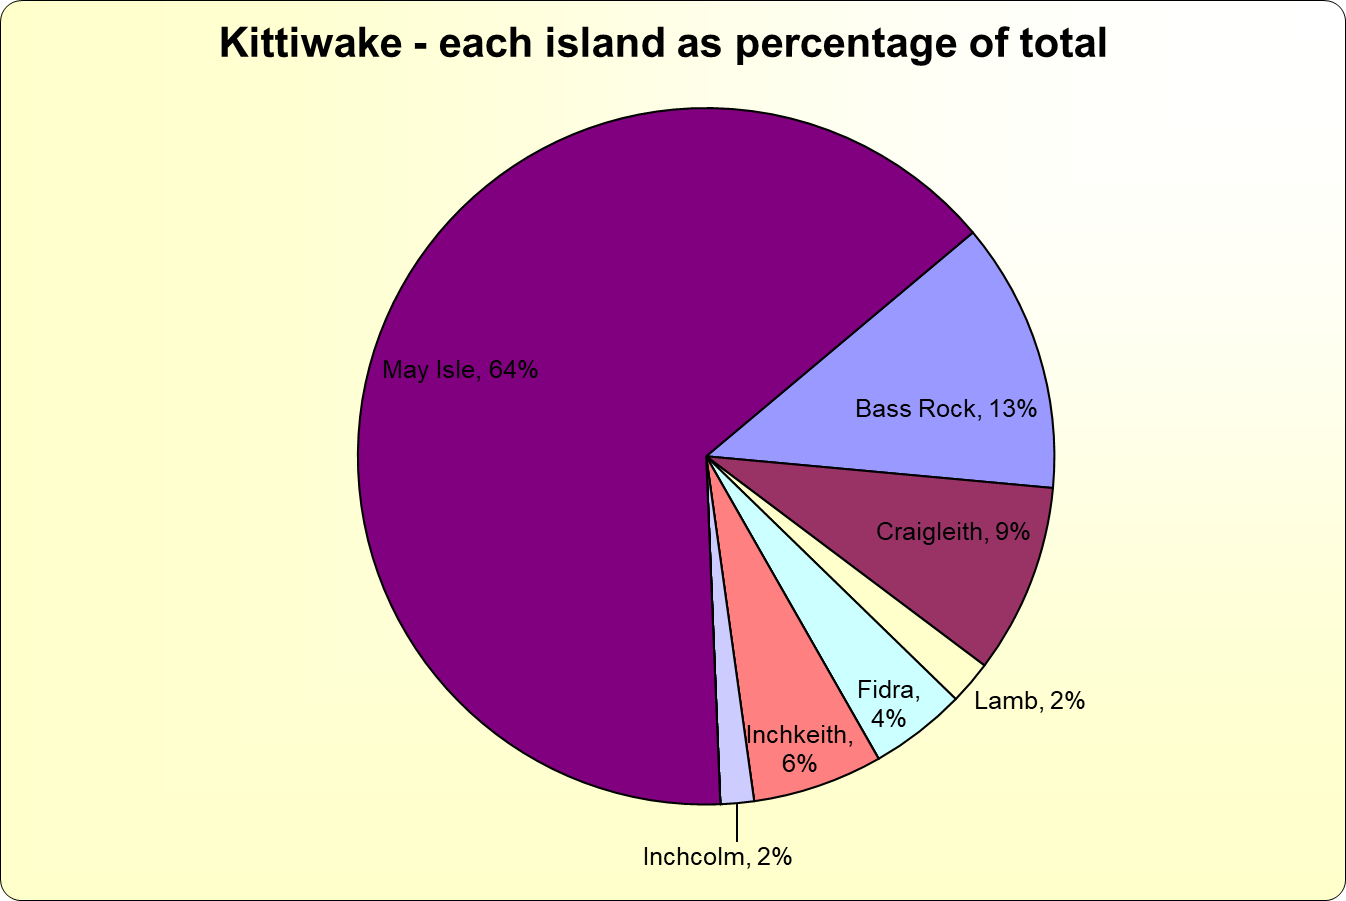
4: Pie chart showing the split of breeding Kittiwake over the different islands.
The chart uses the average number of nests counted on each island since 1994. (This does
not include any estimate for missed counts.)
Choose a topic:
• Home
• Annual Reports
• Summary Tables by year
• Data by species
• How do we count
• Our Islands
• Origins of the Seabird Counts
• Acknowledgements
• Contact us
• Links